Analytics
The dashboard answers “is anything on fire right now”. Analytics answers “what is the shape of the last three months”.
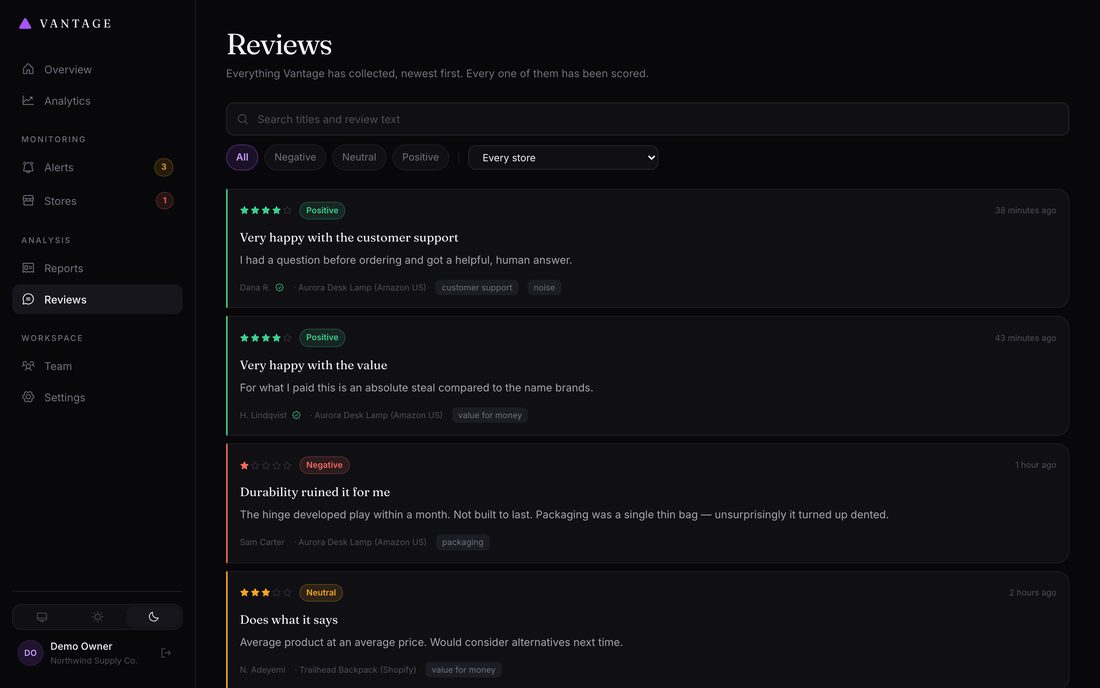
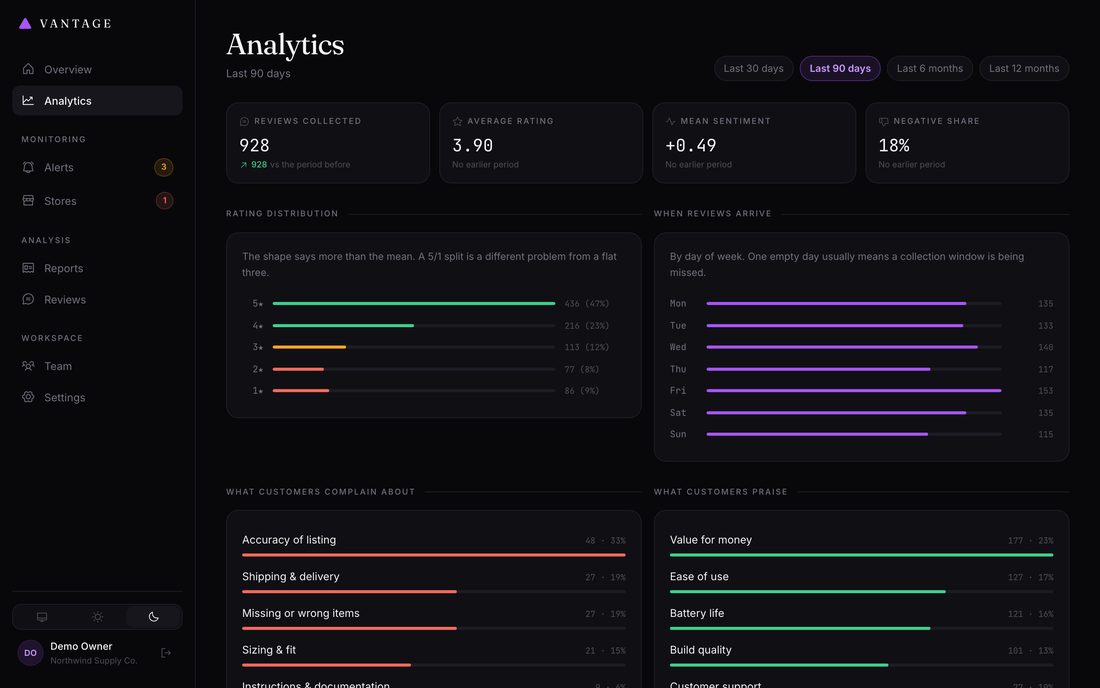
Monitoring → Analytics. Pick a period at the top: 30 days, 90 days, 6 months or 12 months. Every figure recalculates, and the period is kept in the address bar so you can link someone to a particular view.
What is on the page
| Panel | What it tells you |
|---|---|
| Headline figures | Reviews collected, average rating, mean sentiment and negative share — each against the equivalent period immediately before, so a number always has something to be compared with. |
| Volume and sentiment | Week by week. Volume behind, sentiment in front, so you can tell a real shift from a small sample. |
| Rating distribution | The star spread. A bimodal 5/1 split is a very different problem from a flat three-star average, and the mean hides that. |
| When reviews arrive | By day of week. A flat line with one empty day usually means a collection window is being missed. |
| Complaints and praise | Themes aggregated across every report in the period, ranked by how many customers raised them. |
| By store | One row per store, so you can see which is carrying the average and which is dragging it. |
| Collection health | Successful, failed and skipped runs, plus stores currently failing or not collected in three days. Every other number depends on this one. |
| AI usage | Calls, tokens and approximate cost on your own provider account, broken down by model. |
Every figure is counted, not estimated. Each number on this
page is computed in SQL from your own review data. The AI provider, when one is
connected, is only ever asked for language.
Reading it well
- Check collection health first. If runs are failing, everything above it is stale and the trend is an artifact.
- Compare the distribution, not the mean. An average that has not moved can hide five-star reviews being replaced by a mix of ones and fives.
- Watch negative share more than volume. A busy week with the same negative share is growth; a quiet week with double the share is a problem.
- A theme with few mentions but a rising share is usually the one worth acting on before it becomes the top complaint.